Toulouse, France (SPX) Sep 18, 2013

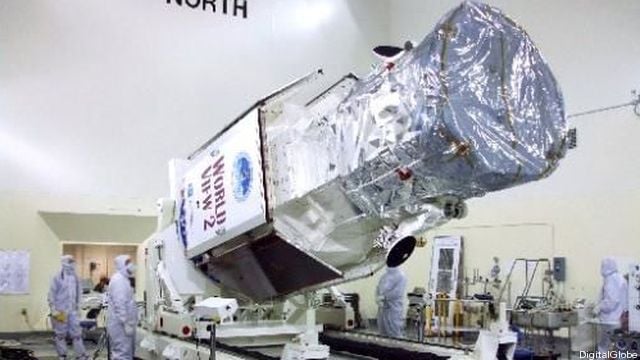
Pleiades 1A and 1B are Europe's first very high-resolution Earth-observation satellites
|
Astrium has announced that it has entered into an agreement with Google
Inc. to provide satellite imagery in support of Google Maps, Google
Earth and other Google products and services. Under this agreement,
Astrium Services will provide newly acquired imagery from its Pleiades
and SPOT satellites.
Pleiades 1A and 1B are Europe's first very high-resolution
Earth-observation satellites, offering exceptional performance to
support both commercial and government markets with 50cm resolution
imagery products. The SPOT 6 and SPOT 7 constellation, operated in
conjunction with Pleiades, offers 1.5m resolution imagery products and
is uniquely capable of mapping continent-wide areas.
This four-satellite constellation makes Astrium Services the first
satellite operator in the world to offer a complete range of
Earth-observation data at different resolutions (from medium to very
high-resolution), an image collection capacity of up to 6.5 million
square kilometers each day and the ability to image every point of the
globe on a daily basis.
With this agreement, Astrium demonstrates again its unique ability to
meet the increasing demand for imagery to support the online mapping and
location-based services markets.
Through its GEO-Information business, Astrium Services is recognized as
one of the leaders in the geo-spatial information market, not least
thanks to the now fully integrated skills and resources of the former
Spot Image and Infoterra.
The company provides decision-makers with complete solutions enabling
them to increase security, boost agricultural performance, maximize oil
and gas or mining operations, improve their management of natural
resources, and protect the environment.
It has exclusive access to data from the SPOT, TerraSAR-X, TanDEM-X and
Pleiades satellites, coupled with a complete range of space-based data
allowing it to offer an unrivalled scope of Earth observation products
and services. This extensive portfolio covers the entire geo-information
supply chain, from the generation of images to the provision of high
added-value information to end-users.
By leveraging the synergies and expertise available across the whole of
Astrium Services, its GEO-Information teams develop innovative, yet
competitive, custom-made solutions based on the combination and
integration of Earth observation, navigation and high-end
telecommunications.
source: http://www.spacedaily.com


 Today,
manufacturers of imaging sensors are responding to two competing
forces: a desire for larger sensors to provide greater spatial
resolution, and the need for improved quantum efficiency for
applications ranging from astronomy to flat-panel inspection.
Today,
manufacturers of imaging sensors are responding to two competing
forces: a desire for larger sensors to provide greater spatial
resolution, and the need for improved quantum efficiency for
applications ranging from astronomy to flat-panel inspection.
.")


